Audio spectrum visualizer with ESP32
This experiment displays audio spectrum using ESP32 module, a microphone and a TFT display. In this sketch, the ESP32 module reads the analog microphone output and performs Fast Fourier Transform (FFT) during each sampling window. At the end of each sampling window, the FFT result is displayed using different colors according to the magnitude of each frequency. Fast Fourier transform is an algorithm that computes the discrete Fourier transform of a sequence. Fourier analysis converts a signal from time domain to a representation in the frequency domain and vice versa. The FFT can be performed via the arduinoFFT library, developed for Arduino and working also for ESP32. This experiment may be improved by adding a low-pass filter between the analog microphone output and the analog input on ESP32, to reduce artifacts. Low-pass filter should cut-off at half the sampling frequency. Hardware set-up
Following hardware is required to build the experiment:
Confused about all acronyms? Here is a brief explanation: GND is the ground line, 3V3 and Vcc are the positive supply line, GPIO39 is the ADC1 channel 3 input (GPIO is generic purpose Input/Output). The following picture shows the Audio Spectrum Visualizer breadboard: 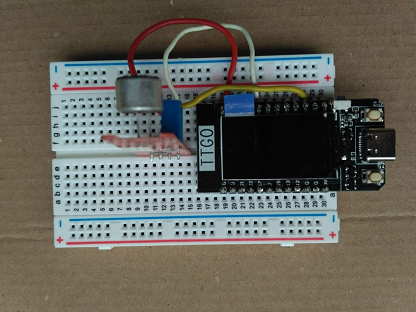
ESP32 software
Before writing software make sure to have installed the software development environment, downloadable from Arduino Software web site. It may be needed to download some library if not already present. Libraries are required also to manage the external devices. The sketch has to include the required libraries: The loop() function implements the Audio Spectrum Visualizer functionality. Download the complete sketch here and enjoy it. |